A Chart Is Worth Some Words
Remember when I told you about Loggerithim? Those were good times! Now we get to talk about the deep, dark rabbit hole I fell in after my work on Loggerithim ended.
Charts were my number one frustration when working with Loggerithim. It’s hard to find a good charting library and it’s harder to build a system around charts when you can’t find a good library for it. At this time Javascript charting was shitty so dynamically generated charts were the thing to do.
Digression: I remember when my dynamic charts were actually written to the filesystem in a temp directory and served and I had to use cron to clean it up. I was an idiot.
Right, Charts! So I made my own!
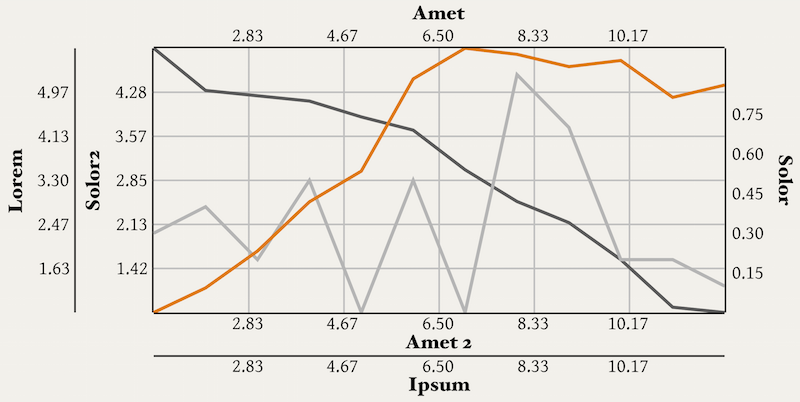
Chart::Clicker
Now you can see how Chart::Clicker came to be. This library started out simple and become insane. I wrote a prodiguous amount of code to support a crazy idea and became a better programmer.
The Crazy
Why do I keep saying that Clicker is crazy? Welp. The first reason is the name is nonsensical. I picked it because it sounded cool. The second and real reason it’s crazy is that Stevan Little introduced me to Moose and listened to my crazy ideas long enough that I turned them into software.

Intermediary Representations
I decided that it would be cool if my chart wasn’t just a bag of shitty bytes but instead was an intermediary representation (IR) that could be transformed into a visual artifact. The idea was to generate a description of the chart — sort of like an AST in programming-land — and write drivers that converted that IR into whatever output you wanted. This was soooorta to serve a client need of embedding charts in PDFs. I’m proud to say it worked. But first I had to bring a bunch of shit to Perl-land.
Perl Shit
First I needed some basic geometric facilities. I had spent lots of time as Java engineer and was spoiled by Java 2D. So I made Geometry::Primitive. I needed to show you the geometry on the output side so I needed Graphics::Color to do that. With those two out of the way I could move up in the world and start thinking about actually creating my IR and Graphics::Primtive was born.
Woe is me. Now I have a dilemma. If I’ve got this IR representing a chart and I need to draw it I’m gonna need some mechanism for layout. I somehow convinced myself that writing something akin to Java’s Layout Managers was a good idea. So then I wrote Layout::Manager.
You should really go poke around in the POD for Layout::Manager. It’s crazy town. Somehow my wife — then girlfriend, if memory serves — didn’t break up with me even though I was constantly drawing on whiteboards and complaining about layout management for weeks.
But in the end, fuckin’ el did it pay off! I ended up with an output agnostic IR that could be passed to drivers such as Cairo to rasterize them. I also learned all about fun things like recursion — which I believe later led me to enjoy functional programming more and drew me to Scala — and the painter’s algorithm.
Here’s a PDF version of a talk I gave at a Perl conference on Chart::Clicker. It was packed and I really felt like I’d done something people cared about. :)
Culmination
In the end I went further into the weeds and wrote Document::Writer which carries this idea further and creates an IR for page layout for fuck’s sake. The incredible part about this, if I do say so myself, was that Document::Writer built on Graphics::Primitive and Clicker charts could be embedded directly in the document and rendered by an arbitrary backend. Fully vector PDFs with charts in ‘em people. I even made a better driver and combined Cairo and Pango for the imaginatively named Graphics::Primitive::Driver::CairoPango.
Unfortunately I can’t find any examples of the output of this work. But it’s awesome.
So, Charting?
Right, sorry. I love telling this story because it is important to me. Chart::Clicker was born because, damnit, I wanted there to be a good charting library. Unfortunately by the time I realized that huge amount of work, client-side charting had really come into it’s own. Client-side charts so significantly better in terms of interaction and presentation. Shucks.
This time also was a golden era for me in terms of friendships, impact and becoming a real member of a technical community. It was a lot of fun.
Feel free to look at all the wonderful things the library could render.
Subscribe via RSS!